The main objective of measure and mapping pixel-by-pixel the refractive index of a sample with nano-scale resolution was achieved based on a proportionality found between the mathematical model (Oscillating Point-dipole Model) and the experiment. The pseudo-heterodyne signal which reaches the detector in an s-SNOM has a frequency spectrum as in the figure below and the experimental detection is employed on two spectral components. Each spectral component can be modeled and the proportionality is calculated for each pixel in the achieved images.
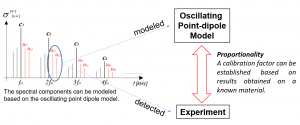
After associating a certain complex refractive index to each possible pixel value, then the mapping of the complex refractive index becomes possible. Usually, the real part of the refractive index is simply known as refractive index, and the imaginary part of the refractive index is known as extinction factor.
Depending on the particular interest of the research, the complex refractive index map can be converted into a map of the complex electric permittivity based on the close mathematical relation between the two physical parameters.
Here we present several results obtained during the Q-NANOBIOTIC project.
Refractive index mapping of a sample containing HeLa cells invaded by Staphylococcus Aureus
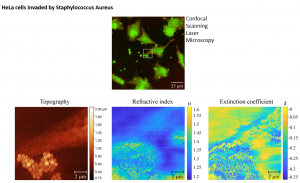
HeLa cells invaded by Staphylococcus Aureus were investigated first by Confocal Scanning Laser Microscopy to for locating an area of interest. Then, scattering Scanning Near-field Optical Microscopy was employed for nano-scale investigations and for calculating the refractive index and the extinction coefficient. The results are represented below.
Test on optical fibers
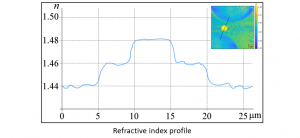
Investigation of the exit head of a Panda-style polarization maintaining single mode optical fiber designed for operating in the 400-680 nm range.Characterization of these types of fibers is difficult due to unusual construction.An efficient method (but limited in resolution): Digital Holographic Microscopy, proposed by Wahba H.H, Optical Fiber Technology, 20, 520-526, (2014).
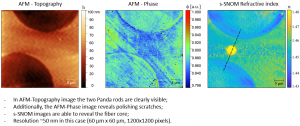 A cross-section along the dotted line is presented below:
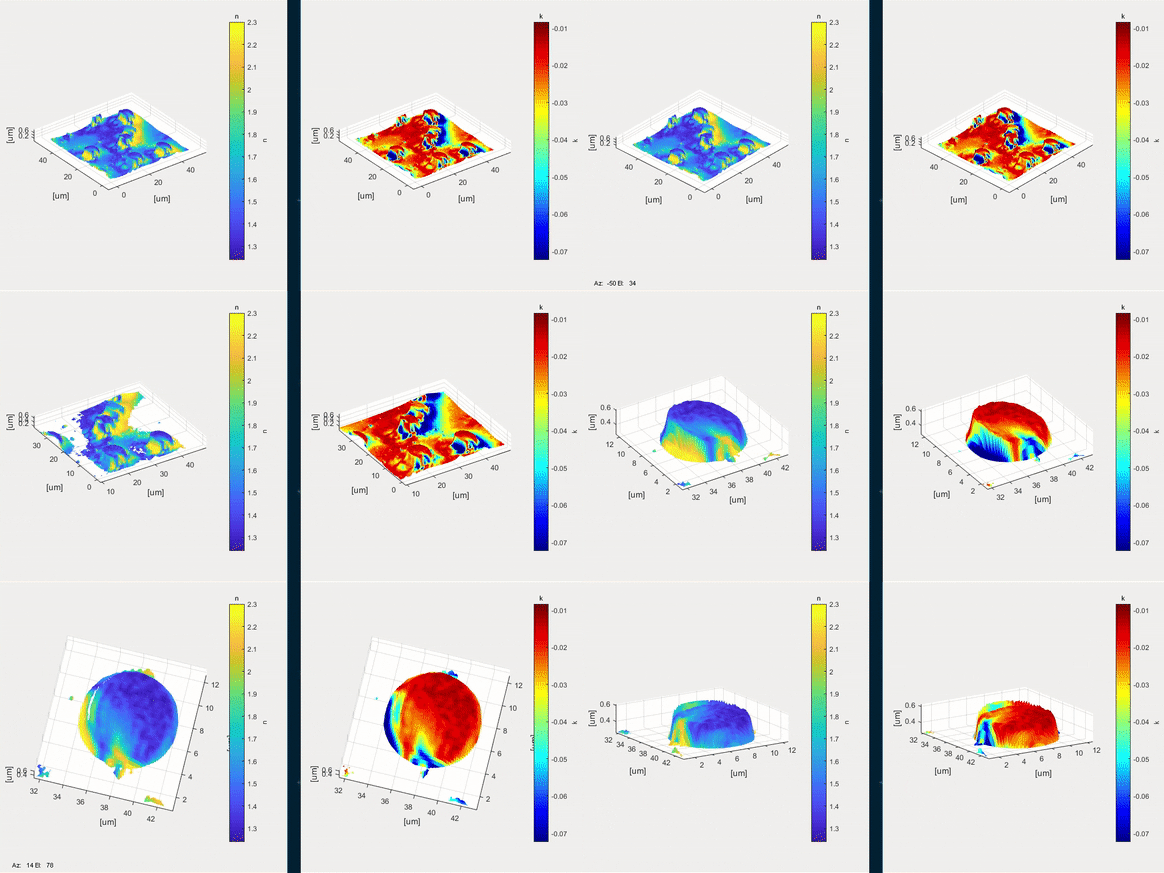
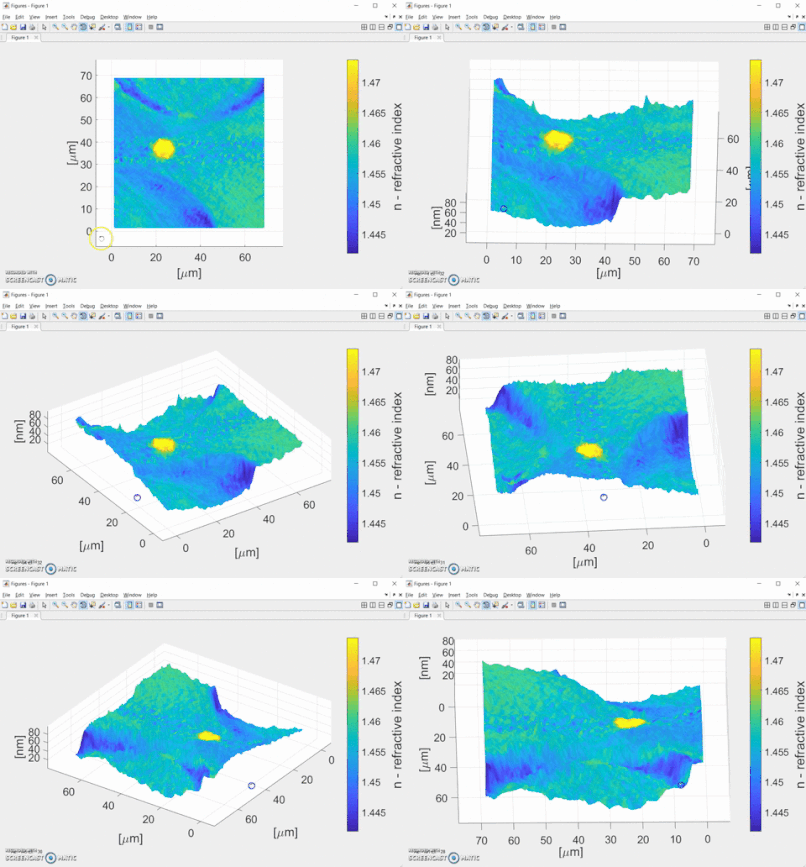
The refractive index map can be represented in correlation to topography in a 4D representation (topography is represented in three dimensions, while the fourth dimension is the refractive index, which is color-coded and lapped over the topography):
Refractive index map of skin tissues sample
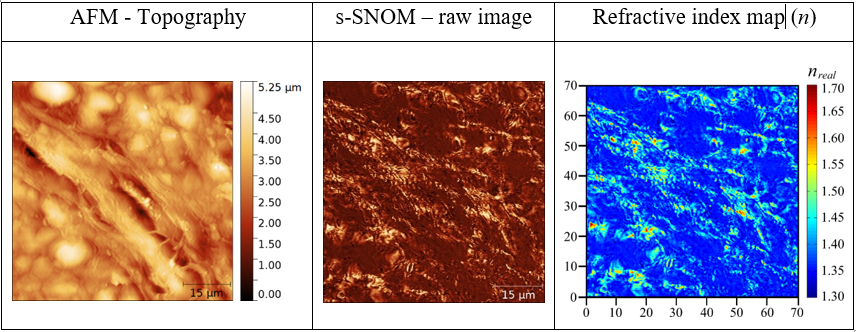 Tissue constituents can be identified based on their refractive index in the map above:
Skin cells: n ~ 1.35;
Collagen: n ~ 1.42;
Melanosomes: n ~ 1.70.
Human erytrocytes
We can represent the refractive index and the extinction coefficient together with the topography, each of the optical parameters in 4D representation with the topography image. The two representations can be correlated such that one can examine in the same time any location about its height, refractive index and extinction coefficient.